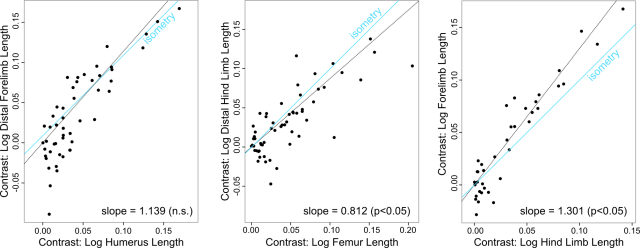
Matt and I have been meeting weekly for the past three weeks to have ODP work days–just to crank through analyses, etc. Mostly, it’s a matter of sitting down and forcing each other to do stuff. Matt’s posting soon, but in the meantime I thought I’d throw out some “final” results. These are regressions on phylogenetically independent contrasts (PICs), with analyses considering the whole sample, unequivocal quadrupeds (following Maidment and Barrett’s assignments), and unequivocal bipeds (following Maidment and Barrett, again).
A few quick notes (all of which are going into the main article text at some point)…PICs were calculated in the PDAP package of Mesquite. Limb lengths were log-transformed prior to analyses (which helped to move things towards normality a little bit, but not entirely). Branch lengths were initially set to divergence times, but we found that these violated the assumptions of PICs, and thus some transforms were used (to be outlined in the manuscript as well as a future post, once we’ve pulled that text together).
Below, I’m including the preliminary results text for this part of the analysis, the associated table, and table caption. Enjoy! And feel free to throw in some comments if you have any.
RESULTS
Intra- and interlimb scaling
Analyses including all taxa as well as analyses considering only unequivocal quadrupeds showed similar scaling patterns. Forelimb length scaled with strong positive allometry relative to hind limb length, whereas the distal hind limb elements (tibia and metatarsal III) collectively scaled with strong negative allometry relative to femur length. The distal forelimb (radius and metacarpal III) scaled isometrically relative to the humerus; however, we note that the lower confidence interval for the entire sample only barely excludes positive allometry. We thus speculate that a larger sample may ultimately demonstrate positive allometry.
When considering only unequivocal bipeds, none of the slopes differed from isometry. However, we note that this subset of taxa also had some of the smallest sample sizes considered here, and a larger sample might uncover allometric scaling patterns.
Table. Results of RMA (reduced major axis) regressions of PICs (phylognetically-independent contrasts) for logged limb segment lengths in ornithischian dinosaurs. In the “Allometry” column, “0” indicates a slope indistinguishable from isometry, “+” indicates a slope consistent with positive allometry, and “-” indicates a slope consistent with negative allometry. The numbers in parentheses in the “Slope” indicate the 95 percent confidence interval for the slope.
|
Grouping |
X |
Y |
Allometry |
Slope |
R2 |
N |
|
All |
Humerus |
Distal Forelimb |
0 |
1.139 (0.996–1.301) |
0.78 |
50 |
|
All |
Femur |
Distal Hind Limb |
– |
0.812 (0.715–0.921) |
0.77 |
59 |
|
All |
Hindlimb |
Forelimb |
+ |
1.301 (1.198–1.413) |
0.94 |
39 |
|
Quadruped Only |
Humerus |
Distal Forelimb |
0 |
1.138 (0.929–1.393) |
0.72 |
29 |
|
Quadruped Only |
Femur |
Distal Hind Limb |
– |
0.742 (0.581–0.949) |
0.57 |
30 |
|
Quadruped Only |
Hindlimb |
Forelimb |
+ |
1.237 (1.027–1.489) |
0.84 |
21 |
|
Biped only |
Humerus |
Distal Forelimb |
0 |
0.829 (0.588–1.17) |
0.75 |
11 |
|
Biped only |
Femur |
Distal Hind Limb |
0 |
0.903 (0.739–1.105) |
0.80 |
22 |
|
Biped only |
Hindlimb |
Forelimb |
0 |
1.009 (0.543–1.876) |
0.23 |
10 |


Hi Andy,
Just a couple of quick thoughts:
1. You could use date.phylo() (tute here: http://www.graemetlloyd.com/methdpf.html) to time-scale your tree. I’m not quite sure what you have done, but I assume if you dated your tree the “traditional” way (all nodes equal in age to their oldest descendant) you would have created a whole bunch of zero-length branches that might be the issue.
2. You should really be using PGLS, not PIC to regress your data against phylogeny. You can do this in R with the “caper” package (and probably some others). I doubt this will mater much though.
Good luck!
Thanks for the comments–very helpful! PGLS vs. PICs is perhaps a point of more debatable contention as far as I can tell, although I certainly appreciate that some of the assumptions of PICs are not really supported in any realistic dataset (e.g., the Brownian motion assumption). In any case, I’m sitting down with Wedel today, and we’ll be running that analysis.
The tree was created/edited in Mesquite; there are no zero-length branches, although there are lots of short-length branches (not much I can do about this when we’ve got a gazillion nearly contemporaneous sister taxa–hadrosaurids are perhaps the most egregious example). In any case, as I port the data into R, I’ll certainly give the data.phylo function a go.
No worries. Happy to help out if you have any issues with it. Can even sit down at a laptop at SVP if it still isn’t finished by then!
PS – I was going to ask if it would be possible to use your data in some teaching exercises at the Paleobiology Database course. Would that be OK?
Absolutely!!!
Hi everyone, I know it’s been a while but is there any chance we’d be able to get a paper written?
Thanks for the prod. After a strong push last year, we lost momentum. We’re going to do our best not to let that happen again. Between travel and general deck-clearing, April is pretty well shot for us, but May looks promising–that’s when we were able to get a lot done last year. This year we just need to get it across the goal line.
Looking forward to it! Anything we can do to help?
Hi! I was wondering if there’s any news on progress on this project, or if there are any plans to write up a paper soon. It would be cool to see all the collected data and analyses published. Thanks!
Hi everyone,
It’s the new year! Should we try to get a paper out?
Happy New Year everyone.